Setup
Send event data
Measure the impact of your feature rollout on your customer experience by sending Harness FME event data and calculating metrics based on those events. Events allow you to record any actions your users perform and experiences your users encounter, such as response times or errors.
Event data can be sent to Harness FME in one of four ways:
- Install Harness FME's RUM Agent or FME SDK Suite which will auto-collect performance event data when installed in a client-side application
- Call Harness FME's SDK
trackmethod (example below) to explicitly add instrumentation code to your application to record events - Post a JSON body to Harness FME's
eventsAPI to ingest events data from existing sources - Harness FME integrations with Segment, mParticle, Sentry, Amazon S3, or Google Analytics to ingest events data from existing sources
Below is an example of calling the track method of the SDK in JavaScript. See links above for the API and integration routes.
// parameters
var queued = client.track('TRAFFIC_TYPE', 'EVENT_TYPE'), eventValue);
// Example
var queued = client.track('user', 'page_load_time', 83.334)
Learn more in the track section of each SDK reference guide (JavaScript example).
Choosing event type names
To create metrics in Harness FME, you must send events using the SDK, Events API, or a third-party integration like Segment. When using the track method via the SDK or Events API, you'll need to choose an event type name.
Naming requirements
Event type names must meet the following requirements:
- 80 characters or fewer
- Start with a letter, number, or left-bracket (
[) - Contain only letters, numbers, hyphens (
-), underscores (_), brackets ([]), or periods (.)
For more information, see the Events documentation.
Recommended naming convention
The Harness FME documentation often uses examples like page_load_time for event names, but a more intuitive convention is to follow an OBJECT.action format.
You may name events like the following for an e-commerce site:
song.playedsong.createdsong.viewedproduct.viewedproduct.addedToCartaccount.profile.address.updated
This convention groups related events together when sorted alphabetically and helps make their purpose immediately clear. For more information on naming conventions, see Segment Academy's naming conventions article.
Efficiency with events
Events can be optimized to ensure that you’re getting the most value out of the events that you send to Harness FME. On a technical level filtering events is easiest when using the track method of the SDK as that is code that can be accessed and reasoned about. Other integrations that may be easy to filter with are the S3 integration or the Events API — in either case the filtering would have to be done before any data is sent to those integrations.
Filtering events by business requirements
One recommended approach is to write up business requirements for the experimentation program and use those business requirements to understand what events are needed to track. From that point onwards you can send just those events to Harness FME. If you decide later on that more events are needed then past events that have been stored in another system can be sent as well. Harness FME will appropriately attribute events from the past as long as the keys, timestamps, and traffic types match up with keys and versions of feature flags. New metrics can be created and the existing data stored in Harness FME’s backend can be attributed even if they hadn't been used before. Computing the impact of the experiment once new data is loaded is a simple click of the recalculate button on the metrics impact tab.
Filtering events by keys
If using pooling or sampling on MTKs, ensure that you are also doing the same filtering on events so that keys not being experimented with don’t have events sent to Harness FME either. Filtering events alone by keys is also possible. If there is a desire to reduce the event count and leave the MTK count alone (such as for getTreatment calls for a percentage based rollout) then filtering events by keys can be done. Fewer MTKs will enter the experiment (as many will have their events dropped) - but this may be ok if only testing for large effects or if the volume is significant enough that experiments are sufficiently powered even with the smaller population.
Do not filter random events. This will cause partial event chains and inconsistent data.
Using the RUM agent or FME SDK Suite
This is one of the simplest approaches to getting started sending events. Harness FME's RUM agent or FME SDK Suite, when installed, will automatically collect events and automatically create metrics. If you are already using the FME SDK in your application on the client side, you can upgrade to using the FME SDK Suite and take advantage of the events automatically generated. Even if you are only using Harness FME on your application backend, you can still take advantage of our Client Side FME RUM agents. Harness FME will join across based upon the user or anonymous key sent to the RUM agent on the front end with the SDK on the back end to be able to compute the metric impact.
For more information on the specific installation instructions, events captured and metrics automatically created, please refer to our help documentation for your selected RUM agent or FME SDK Suite.
Using the SDK track method
Use the track method to record any actions your customers perform. Each action is known as an event and corresponds to an event type. Calling track through one of our SDKs is the first step to getting experimentation data into Harness FME and allows you to measure the impact of your Harness FMEs on your users’ actions and metrics. In the following examples, you can see that the .track() method can take up to five arguments. The proper data type and syntax for each are the following:
- key: The
keyvariable used in thegetTreatmentcall and firing this track event. The expected data type is String. - TRAFFIC_TYPE: The traffic type of the key in the track call. The expected data type is String. You can only pass values that match the names of traffic types that you have defined in your instance of Harness FME.
- EVENT_TYPE: The event type that this event should correspond to. The expected data type is String. Full requirements on this argument are:
- Contains 63 characters or fewer.
- Starts with a letter or number.
- Contains only letters, numbers, hyphen, underscore, or period.
- This is the regular expression we use to validate the value:
[a-zA-Z0-9][-_\.a-zA-Z0-9]{0,62}
- VALUE: (Optional) The value to be used in creating the metric. This field can be sent in as null or 0 if you intend to purely use the count function when creating a metric. The expected data type is Integer or Float.
- PROPERTIES: (Optional). A Map of key-value pairs that can be used to define or filter a metric. Refer to the event properties section for more information.
The following is an example in Java.
Other SDK languages each have specific syntax that need to be followed on their own help pages. Refer to our SDK documentation for more information about using the track call for your selected SDK.
// If you would like to send an event without a value
boolean trackEvent = client.track("key", "TRAFFIC_TYPE", "EVENT_TYPE");
// Example
boolean trackEvent = client.track("john@doe.com", "user", "page_load_time");

// If you would like to associate a value to an event
boolean trackEvent = client.track("key", "TRAFFIC_TYPE", "EVENT_TYPE", VALUE);
// Example
boolean trackEvent = client.track("john@doe.com", "user", "page_load_time", 83.334);

// If you would like to associate a value and properties to an event
boolean trackEvent = client.track("key", "TRAFFIC_TYPE", "EVENT_TYPE", VALUE, {PROPERTIES});
// Example
HashMap<String, Object> properties = new HashMap<>();
properties.put("package", "premium");
properties.put("admin", true);
properties.put("discount", 50);

boolean trackEvent = client.track("john@doe.com", "user", "page_load_time", 83.334, properties);
Considerations
This method generally is best for two use cases:
- You are new to event tracking and experimentation in general. If Harness FME is the first time you are tracking events, then using Harness FME's track method is a great way to start.
- You already have one or more tools that do tracking and have a wrapped function that calls all of your trackers. In this case, it would be straightforward just to add Harness FME's track method to that function.
When using the track method we strongly recommend wrapping the function. If you are in the first use case and early on your experimentation journey, it is important to ensure a quality code architecture and as such wrapping the track call allows further extensibility to other applications that you may be tracking with later on.
Level of effort using the track method
The following explains the level of effort you can expect when using this method to send events to Harness FME.
Using the track method requires that you call this function for each of the events you want to track. This would include multiple traffic types and every event that you may want to use to measure the impact of a feature flag treatment. If you are already tracking events using other systems, you can include Harness FME's track method in a wrapped call with your other trackers.
If you are already using a system for tracking events and Harness FME has an events integration with that system, Harness FME would recommend that approach over using the track method.
How events flow through the Harness FME pipeline
This section describes the path an event takes from an instance of the Split SDK, where the track method is called, to the datastore used for calculating metric values from that event.
In order to accurately attribute events to treatments, the timestamp in the event is captured and recorded when the track method is called, so independent of any latency in transmission, the event has an accurate timestamp for when it occurred. This is the timestamp that will be compared to a feature flag's versions and impressions to determine if the event can be attributed to a treatment.
A variety of design factors were considered in the implementation of the Split pipeline—speed, stability, accuracy, and comprehensiveness. While Split aims to bring the fastest time to value possible in our pipeline, the platform prioritizes stability and accuracy, which are especially important in experimentation.
Here's what happens after you call track:
-
SDK to API: The API send events in batches, as configured by an SDK configuration parameter, (for instance, in the Java SDK, the parameter is
eventFlushIntervalInMillis). The default value of this parameter is stated in the documentation for each SDK; for most SDKs it is 30 seconds. Another parameter sets the size of the events queue (in the Java SDK, the parameter iseventsQueueSizewhich defaults to 500). When the events queue is full, the SDK will flush its content and post the events to the Split cloud, regardless of the setting of the flush interval parameter. -
API to Queue: The API writes data to an ingestion queue, this typically takes only a few milliseconds.
-
Queue to S3: Uses the shortest possible buffer time for AWS firehose, which is 60 seconds.
-
S3 to Data Lake: A job retrieves the raw events data and processes it for storage in the Split data lake, ready for analysis. Typical run time for this job varies from 2 to 5 minutes depending on load.
-
Data Lake to Calculated Result: Jobs are scheduled based on how long the experiment has been running, since older experiments have low variance over small windows of data. Once a job begins, it takes from 15 seconds to 5 minutes to process and save the results, depending on the data volumes involved.
The last update time shown in a feature flag's metric impact tab is based on when the job completes. Typically, it's fair to estimate about 5 minutes of pipeline delay from the time the event is received to the time it is available for processing. In many cases, the pipeline is faster than that (both the SDK and firehose buffer times are trains leaving a station, if you get there just before the train departs you don't wait long). Spikes in data volumes can add delay to the pipeline.
Using the events API
You can post a JSON body to Harness FME's Events API to ingest event data from existing sources. You can see the schema for sending an event in the following:
[{
  "eventTypeId": String,
  "trafficTypeName": String,
  "key": String,
  "timestamp": Number,
  "value": Number,
  "properties":{String: Any,String: Any, etc.}
}]
Considerations
Using the events API makes sense when you have a stream of events from some other system where you are tracking events that you can tap into.
If you are already tracking user events with some other system and it offers some kind of webhook, one common approach is to use a serverless function like AWS lambda to transform events from that webhook into Harness FME's format and send those events across to Harness FME.
Another possible use case would be the scenario where you have a system that cannot or will not be running the FME SDK but still needs to track events. The advantage of using the events API over the SDK is that almost every single programming language has the ability to make HTTP API calls. So any internet connected application can send events to Harness FME with this method.
There is no rate limit on the events API. It can handle any volume of load of events. However, it is recommended to keep individual payload sizes under 1 megabyte.
Level of effort using the events API
The level of effort for implementing the events API is low. It is a straightforward HTTP API call with a JSON formatted body and authenticated with a Bearer auth token. If the events data can be tapped into from some sort of events stream, or some application that is already tracking events and formatted into Harness FME's Events format, it can be sent across to Harness FME.
Using integrations to send events
You can use Segment, mParticle, Sentry, Amazon S3, or Google Analytics (GA) to ingest event data from existing sources. Using these integrations allows you to avoid explicitly sending events to Harness FME and instead send events to these systems that forwards them on to Harness FME.
Considerations
If you're already tracking events using Google Analytics, mParticle, Segment, or Sentry, Harness FME strongly recommends using these integrations for ease of ingesting events. One thing to be aware of is that these integrations typically send all events from the source system to Harness FME. Specifically the Sentry, Segment, and mParticle integrations do not have filtering to only send some events. The GA integration can be configured with filters. The Amazon S3 integration requires filtering when the file is generated, if events were to be excluded.
The Amazon S3 integration is best used when event collection is already centralized and AWS infrastructure is available for use. Then the events can be piped directly to Harness FME with this integration.
Level of effort using integrations
The Sentry, Segment, and mParticle integrations are similar in that there is no engineering effort required to load events captured within these systems. There is configuration that has to happen within Harness FME and within the third-party application to map the events and traffic types to what they will be in Harness FME. For more information, view the specific pages of each of these integrations in the help center.
The Google Analytics integration is for the browser only and requires the SDK to be instantiated on any page that you want to use it on. Once instantiated in code, it allows sending GA hits to Harness FME automatically without needing to track individual events. This can also be used in concert with our Google Tag Manager (GTM) helper script that adds Harness FME's tracker automatically to any GTM trackers.
The Amazon S3 integration requires infrastructure work of creating a new S3 bucket and setting up files with the proper naming convention, data schema, file format, and compression algorithm. The user doing this setup needs rights to set the bucket policy as well.
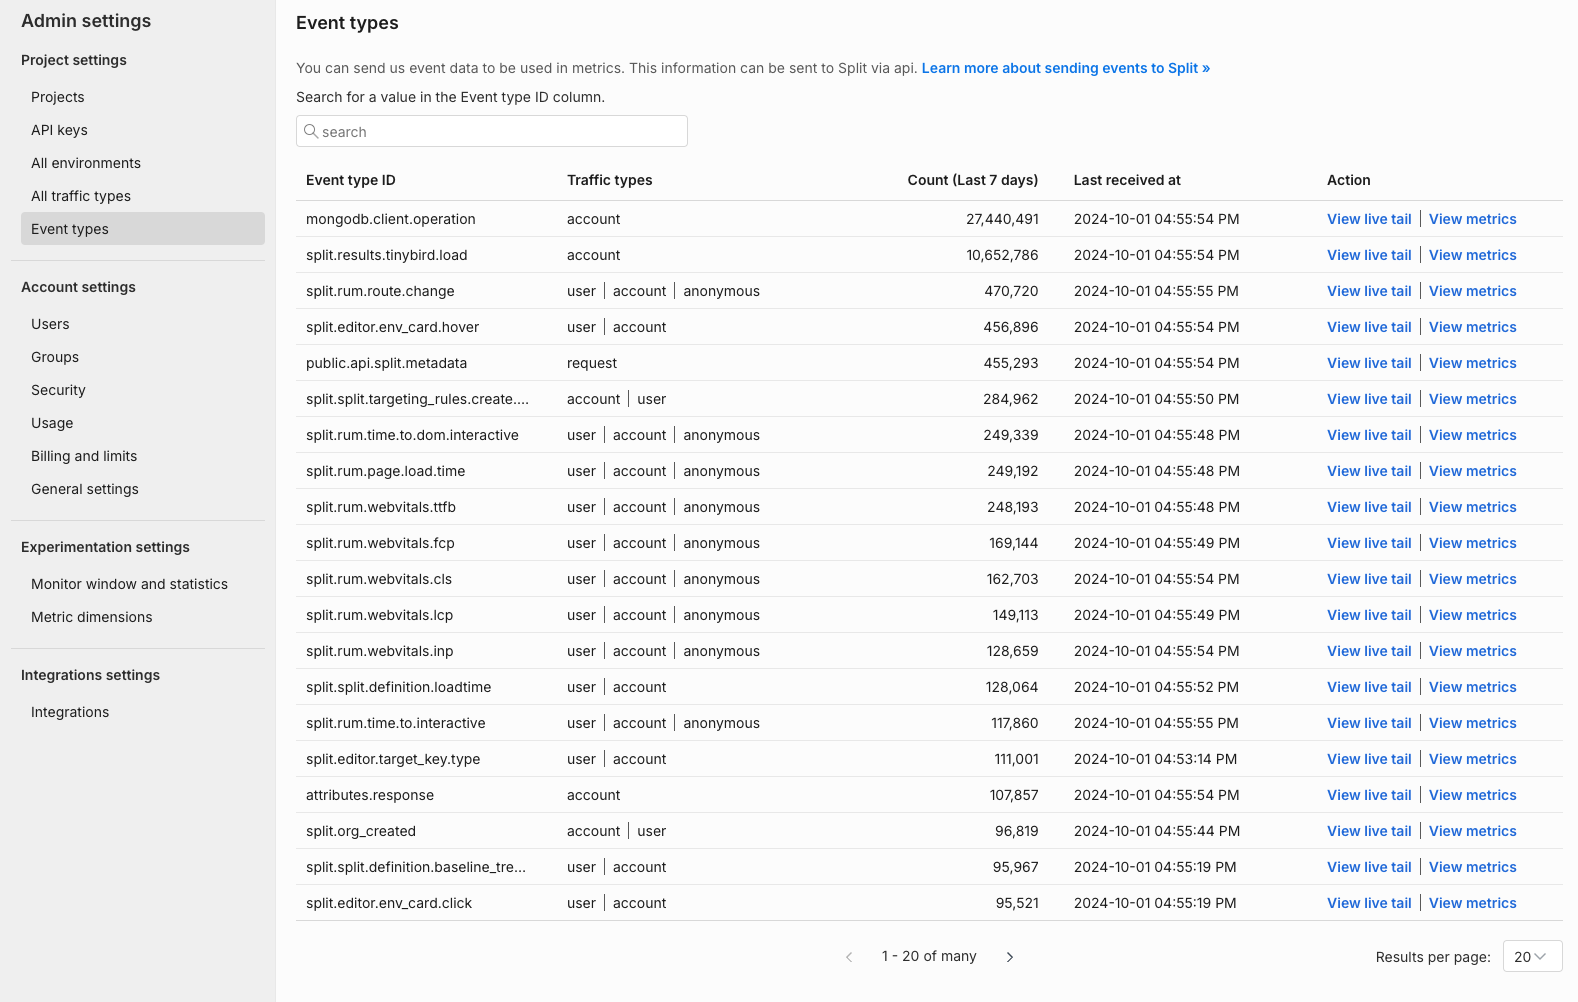
Confirm events are being received
To help verify that events are being received by Harness FME, from the left navigation pane, click the profile button at the bottom, select Admin settings, and click Event types. There you can see event types and a stream of events per event type.